Traditional logging
- Developer adds LogInformation calls across services
- Issue hits production
- Logs show a status code—not SQL, HTTP, or parameters
- Reproduce locally and ship more logging in the next deploy
Production Debugging for .NET
Investigate live requests with parameters, SQL queries, HTTP calls, and exceptions captured automatically—full execution context for production incidents.
No manual logging. No scattered instrumentation. No guessing.
dotnet add package ArgusLogsQuick Start guide →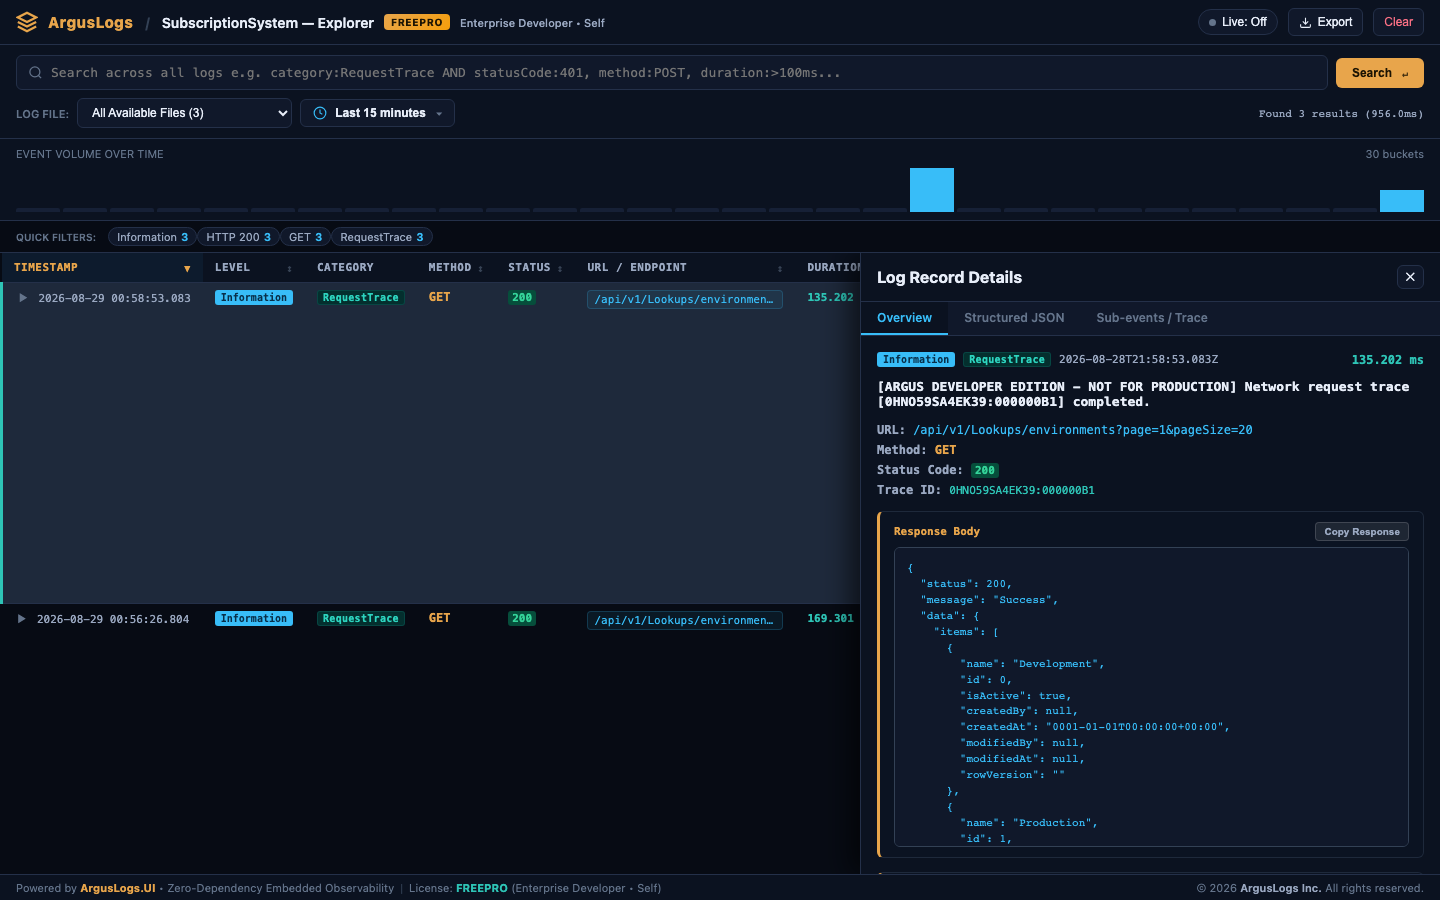
The problem
A customer reports an error. You search the logs.
You see a status code or generic message—but not the SQL that ran, the outbound HTTP call, or the parameters that mattered.
So you reproduce locally, add more logging, and wait for the next deploy before you can learn anything useful.
ArgusLogs captures SQL, HTTP, parameters, and exceptions automatically—the context you needed was already in production.
Traditional logging vs ArgusLogs
Don't predict which information you'll need later.
Why Argus
Every production request leaves a full trail automatically—so you debug from evidence, not guesswork.
Know what ran in production—the entry point, downstream work, and where it failed—in one correlated timeline.
Find the failing request by user, route, or trace ID and follow the evidence—without reproducing the incident or attaching a debugger to production.
Fix from facts captured at failure time instead of guessing what to log before the next deploy.
Capabilities
Seven capture domains—from the incoming request to nested SQL and HTTP—so you investigate production failures with evidence, not guesswork.
Example POST /api/orders → 500 · 842ms
Example orderId=1042 · customerId=7a3f…
Example SELECT … FROM Orders WHERE Id = @id · 18ms
Example GET payments.example.com → 503 · 61ms
Example PaymentDeclinedException: card declined
Example trace:fa7dedf4-ec83-4b6e-a3f3-…
Example [LogMethod] on OrdersController.Create
How it works
Install NuGet packages, let automatic instrumentation capture production execution, and investigate from ArgusLogs.UI.
Add ArgusLogs NuGet packages and apply [LogMethod] or configured aspects to the methods you want instrumented.
At runtime, woven code records SQL, HTTP, parameters, exceptions, and trace context around each instrumented request.
Search by trace ID, user, or route in ArgusLogs.UI and open the correlated timeline for the failing request.
Fix from production evidence—without reproducing the incident or shipping another logging deploy.
Production debugging
Many production failures can't be replayed—a specific user, load pattern, or integration state never shows up on your machine. ArgusLogs captures SQL, HTTP, parameters, and exceptions from the live request so you investigate from what already ran.
Microservices
One checkout can cross an API gateway, order and inventory services, database queries, and a payment API. ArgusLogs records SQL, HTTP, and exceptions on each instrumented .NET service with shared trace IDs so you follow the path in ArgusLogs.UI.
Correlates traces across instrumented .NET services and captured outbound HTTP—where trace headers and NetworkTracker are configured.
Built for .NET
ArgusLogs ships as multi-target NuGet packages for .NET 5 through .NET 10—with ASP.NET Core, EF Core, ADO.NET, and HttpClient integrations where configured.
For developers
Write your application. Let Argus capture the context.
public async Task<Order> ProcessOrder(Order req)
{
    var sw = Stopwatch.StartNew();
    _logger.LogInfo($"Start ProcessOrder for {req.Id}");
    try
    {
        var result = await _db.Orders.AddAsync(req);
        _logger.LogInfo($"Successfully saved Order {req.Id}");
        sw.Stop();
        _logger.LogMetric("ProcessOrder_Duration", sw.ElapsedMs);
        return result;
    }
    catch (Exception ex)
    {
        _logger.LogError(ex, $"Failed to process {req.Id}");
        throw;
    }
}[LogMethod]
public async Task<Order> ProcessOrder([Sensitive] Order req)
{
// That's it.
// ArgusLogs handles the rest automatically.
return await _db.Orders.AddAsync(req);
}Use cases
Investigate live failures with SQL, HTTP, and exceptions captured automatically—without reproducing the bug.
ExploreTrace failed API requests with inbound routes, outbound calls, and correlated context.
ExploreFind slow or failing queries with parameters and duration tied to the parent request.
ExploreFollow shared trace IDs across instrumented .NET services and captured HTTP hops.
ExploreReconstruct what happened during an outage from production evidence in one timeline.
ExploreFilter by user ID or trace ID in ArgusLogs.UI to debug one customer's failing journey.
ExploreQuick start
Create a Development or Production key without signing in. Paste ArgusLogsKey into appsettings.json.
Add ArgusLogs and ArgusLogs.DataAnnotation NuGet packages to your .NET project.
Apply [LogMethod] or aspects and wire ASP.NET Core middleware where needed.
Deploy and exercise your app—woven instrumentation captures context on the first live request.
Open ArgusLogs.UI, search by trace ID or route, and inspect the correlated timeline.
Install from NuGet
Latest published packages for .NET projects. · 1.0.11-alpha.2608292142
dotnet add package ArgusLogs --version 1.0.11-alpha.2608292142
dotnet add package ArgusLogs.DataAnnotation --version 1.0.11-alpha.2608292142Performance
ArgusLogs uses compile-time instrumentation—not runtime reflection or hand-written logging in every method. Same machine, same payload, BenchmarkDotNet versus ILogger + Serilog.
Means from the published run. [LogMethod] vs the matching hand-written ILogger ENTER/EXIT. Full tables and methodology on the benchmarks page.
Security
Control sensitive parameters, who can open ArgusLogs.UI, and how long telemetry is retained—without sending production data to a mandatory SaaS pipeline.
Compare
ArgusLogs focuses on deep .NET production debugging—not replacing every logger or APM suite. The table below shows how automatic instrumentation compares to traditional logging for the investigation tasks teams care about most.
| Feature | ArgusLogs | Traditional |
|---|---|---|
| Business Code Pollution | Clean business code (automatic instrumentation) | High (Manual _logger.Log() everywhere) |
| Investigation depth | Parameters, return values, duration, SQL, and HTTP in one correlated view | Shallow text messages |
| Sensitive data in production | Automatic encryption for tagged parameters via [Sensitive] | Requires DIY masking or complex plugins |
| SQL & HTTP context | See queries and outbound calls tied to the failing request | Needs complex custom enrichers |
| One view per request | One structured entry connects start, end, errors, and child spans | Scattered Start/Stop/Error entries |
| Follow one user or trace | Group by UserId or TraceId without a separate analytics pipeline | Requires ELK/Splunk to trace a user |
Different tools solve different problems. Serilog, OpenTelemetry, Elastic, Datadog, and Dynatrace each excel in their own domains—we outline where ArgusLogs fits alongside them on our dedicated comparison pages.
Pricing
ArgusLogs is free to use—you generate a license key after signup. No APM-style ingestion tax when you need deeper visibility during an incident.
Free
Start in Development with a free license key.
Free
For Staging—with optional tracker features where your plan allows.
Free
For Production with the full ArgusLogs feature set.
All plans are free today. Plan duration and feature limits are shown during license setup.
Under the hood
Explore how compile-time weaving, automatic instrumentation, and ArgusLogs packages fit together—from architecture to data capture in production.
NuGet
Configure once and correlate execution context across threads and requests during production incidents.
NuGet
Automatically instruments .NET assemblies at build time—telemetry is woven in without runtime reflection.
NuGet
Investigate traces at /argus-logs with search and drill-down—no separate log viewer required.
ArgusLogs
RSA-backed license checks and offline entitlement validation for enterprise deployments.
Who it's for
ArgusLogs is not generic observability for every stack—it is purpose-built for .NET engineers, the leads who run incidents, and the leaders who own reliability.
Primary · .NET developers
Filter traces in ArgusLogs.UI, inspect SQL and HTTP child spans, and follow exceptions with parameters captured automatically—without littering controllers and services with LogInformation calls.
Secondary · Tech leads & engineering managers
Give on-call engineers correlated request timelines instead of log archaeology. Resolve incidents faster when every method, query, and outbound call shares a trace ID.
Leadership · CTOs & engineering directors
Keep telemetry on your infrastructure with TieredStorage and the embedded UI. Reduce dependence on heavyweight SaaS APM for .NET-only estates while improving incident visibility.
Embedded diagnostics
Mount the embedded log viewer at /argus-logs to browse histograms, KQL search, and trace detail without shipping logs to a separate SaaS dashboard.
Live dashboard walkthrough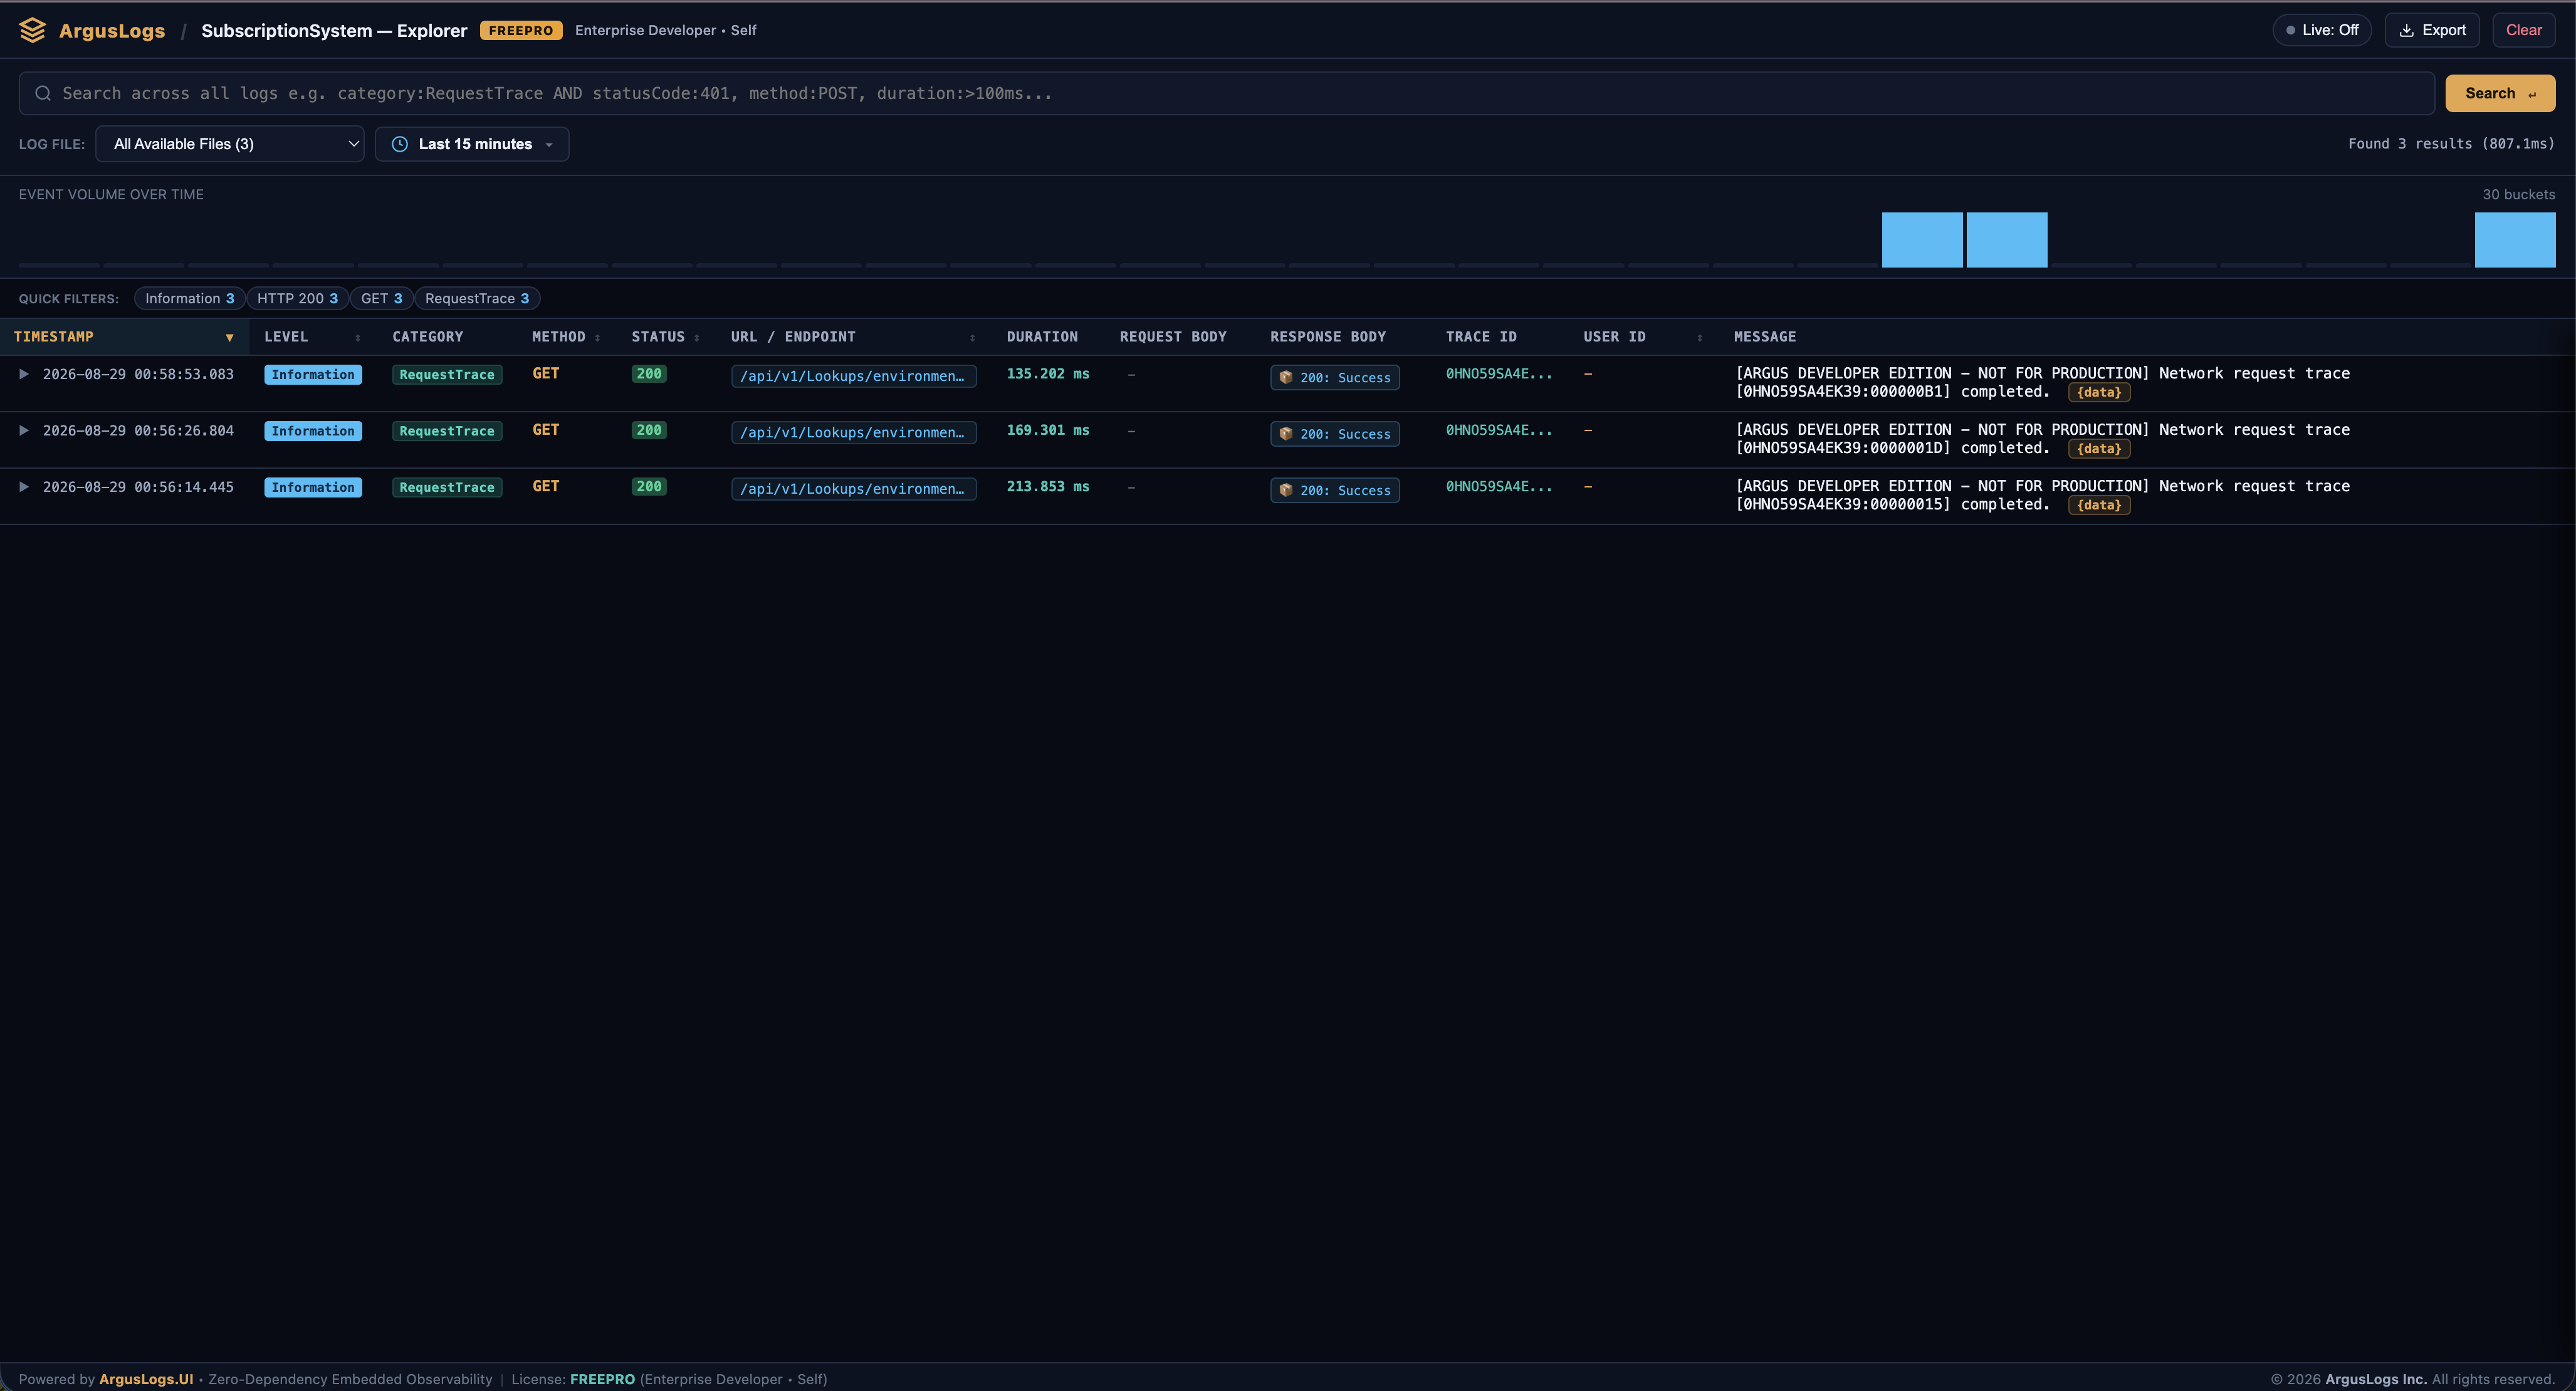
FAQ
ArgusLogs is a production debugging and observability platform for .NET applications. Compile-time IL weaving captures execution context—requests, SQL, HTTP, exceptions, and traces—so teams can investigate production incidents without reproducing bugs or sprinkling manual log statements through business code.
ArgusLogs is built for .NET developers debugging production systems, tech leads and engineering managers who need faster incident resolution, and CTOs or engineering directors who want production reliability without heavyweight SaaS agents on every .NET host.
Where supported by your configuration and integrations, ArgusLogs records structured telemetry including:
Traditional logging depends on developers predicting what to log before an incident. ArgusLogs uses compile-time instrumentation to capture execution context automatically—parameters, SQL, HTTP, and exceptions in one correlated view—without sprinkling LogInformation calls through business code.
Production .NET failures often lack the SQL, HTTP, and parameter context needed to understand root cause. Teams waste cycles reproducing bugs or redeploying with temporary logging. ArgusLogs captures that forensic context automatically so you investigate from evidence captured when the failure happened.
Install ArgusLogs NuGet packages, enable argus-weaver at build time, and call UseArgus() in Program.cs. Compile-time IL weaving injects aspects around configured methods; at runtime structured telemetry flows to sinks, TieredStorage, or ArgusLogs.UI at /argus-logs. See /how-it-works for the full flow.
ArgusLogs reduces the need for repetitive LogInformation calls for parameters, SQL, and HTTP context. You may still use ILogger or Serilog for business events you choose to emit. ArgusLogs focuses on automatic execution forensics; manual logs and ArgusLogs structured output can coexist.
Datadog is a cloud APM platform priced around ingest and host licensing. ArgusLogs is a .NET-native production debugging platform with compile-time instrumentation and optional embedded UI—you control where telemetry lives without mandatory SaaS ingest. See /compare/argus-vs-datadog for a feature-by-feature comparison.
Automatic instrumentation means ArgusLogs weaves logging and tracing aspects into your .NET assemblies at compile time via argus-weaver and [LogMethod]. You configure which methods are instrumented; the runtime captures entry, exit, parameters, SQL, HTTP, and exceptions without hand-written logging in every code path. See /learn/what-is-automatic-instrumentation.
You add NuGet packages and apply [LogMethod] or similar annotations to methods you want instrumented. You do not need repetitive LogInformation calls for parameters, SQL, or HTTP context.
ArgusLogs NuGet packages multi-target .NET 5, .NET 6, .NET 7, .NET 8, .NET 9, .NET 10. See /docs/dotnet-versions for package alignment details.
Yes. ASP.NET Core HTTP request and response capture is supported where the NetworkTracker integration is configured. See /docs/aspnet-core and /aspnet-core-logging.
Serilog is a logging library—you choose what to write and when. ArgusLogs is a production debugging platform that captures method, SQL, HTTP, and exception context automatically via compile-time weaving. See /compare/argus-vs-serilog for a fair comparison.
OpenTelemetry standardizes traces and metrics export. ArgusLogs focuses on deep .NET instrumentation at compile time and can complement OTel in hybrid setups. See /compare/argus-vs-opentelemetry and /learn/what-is-automatic-instrumentation.
Yes. ArgusLogs is designed for production debugging—instrumentation is woven at build time, sensitive parameters can be encrypted with [Sensitive], ArgusLogs.UI supports login and authorization filters, and TieredStorage retention policies help you control how long telemetry is kept.
Start at /docs/getting-started, follow the developer tutorial at /tutorial, and browse topical guides such as /dotnet-observability.
ArgusLogs.UI is an embedded diagnostics dashboard mounted at /argus-logs in your ASP.NET Core app. It provides histograms, KQL search, and method trace detail without shipping logs to a separate SaaS.
Built for .NET. Designed for developers. Ready for production.
Stay in the loop
Join ArgusLogs followers for release notes, tutorial drops, and launch news. No spam — unsubscribe anytime.